
Each interaction garnered through likes, comments, or shares contains vital data. But how does one tap into this resource? There is a simple solution- Social Media Reports. These allow you to deconstruct the ins and outs of your client’s social media metrics and know the exact status of each social media account through continuous monitoring and tracking. A social media report can be instrumental in explaining your progress on social media through relevant insights obtained through the data.
What is a Social Media Report?
A social media report is, in essence, a detailed document that tracks your client’s social media activities and presents all the relevant information in an easily comprehensible way for your client. It is used to make the most out of valuable data generated through social media networks like Instagram, Facebook, Twitter, YouTube, LinkedIn and others. Simply using your intuition as your social strategy does not cut it in this day and age. It is crucial to capitalize on the data you acquire through social media and use it to your advantage. This is where social media reporting comes into play. These reports are based on data and statistics that are customized based on your client’s social media marketing objectives and efforts. This report may be in the form of a simple spreadsheet or could be a dazzling presentation to impress your client.
The nature of your report depends on who your target audience is and the purpose that it aims to serve. Social media reports track and analyze important metrics like the number of followers, likes, subscribers and other forms of engagement over different time intervals to gauge your client’s performance and growth.
Elements of an excellent Social Media Marketing Report
An excellent social media marketing report maximizes your ROI by monitoring and measuring your social media efforts. It enables you to make smarter, more calculated, and better-informed decisions. Depending on the objective and target audience, each report may vary.
A good report has a few common elements that help you make the most out of the data extracted
- Goals and targets: An aspect of each social media report that you simply cannot overlook! This represents an organization’s route to get to their ultimate strategic goal. It will help them determine where they need to improve and whether they are heading in the correct direction. Setting objectives and goals is a pretty cumbersome process. The goals must be practical and attainable for your client’s business. For this purpose, a SMART goal-setting framework is often used. (SMART- Specific, Measurable, Achievable, Relevant and Timely)
- Important metrics: Undoubtedly, the most crucial element in any social media report is its content metrics. By analyzing the metrics you can understand whether the target audience prefers video, audio, or image content, amongst other media forms. You may also compare the interactions with sponsored content vs non-sponsored content. A few common metrics are the number of leads generated, total revenue generated, total return on investment (ROI), total budget spent, social sentiment and share of voice, etc. Some important social media metrics to track include reach (the number of individuals who have viewed your content), impressions (the number of times people view your content; often higher than reach because the same individual may view your content more than once), audience growth rate (how many new followers you acquire in a certain time period), engagement rate, etc. For a more detailed understanding of Social Media Metrics check out our blog on the most important social media metrics to track. (** link 15 Crucial metrics a Social Media Manager should know).
- Results per channel: This aspect of the report contains specific results for each social media channel. It can further be broken down into even more specific details, for example Posts vs. Reels within Instagram. The data included in this section varies based on the goals and targets. A few common numbers for each social network are the number of posts, engagement rate, click-through rate, top-performing posts, net followers gain or loss, etc.
- Achievements: It is vital to display achievements that work towards your outlined goals and objectives. This enables you to get a general overview of your social media strategy. Tracking weekly or monthly results allows you to identify patterns and ongoing trends. This is also a very essential section as it helps to share your progress with your client.
- Opportunities: A good social media report must also include opportunities that are uncovered by extensive analysis of the data. For example, by analyzing the comments on a particular post, you can see that the target audience would like to have an FAQ highlight story section on Instagram that answers their questions. This serves as a good opportunity to boost the customer experience and engagement.
- Summary: Wrapping up the report neatly with a clear summary highlighting all the main takeaway points and insights helps to plan future goals and strategies. This also helps your client understand how their business is progressing in a quick but efficient manner.
How to create the Ultimate Social Media Report Creating the Ultimate Social Media Report is all about the preparation – the who, the what, the why, and the how. Having SMART goals and a well-defined framework goes a long way in determining the report’s success. To create the Ultimate Social Media Report you must first analyze your objective and gather data accordingly. The data may be internal or external. This is followed by using the appropriate tools for insights, reporting, visualization and dashboarding. Now that you have figured your tools out, you can make predictions and define your next steps. Finally, you must automate the report for future presentations. Here are some steps on how you can create your social media report:
Analyzing your Objective and Goals:
Analyzing your objective and goals is the first step in creating your report. You must identify your report’s audience to share only relevant information with each client. You may have to create different reports based on whom you will be presenting it to. So, it is important to gauge your audience based on your goals. You must ask yourself what you’re hoping to achieve through your report, be it assessing your client’s reach, brand awareness, engagement or sales. Concentrate on the key performance indicators (KPIs) and metrics that are relevant to your client and focus on only those. Figure out the questions you are trying to answer and center your report around that. Having SMART questions will bring clarity and conciseness to your report.
- Specific (focused and quantifiable goals)
- Measurable (how you track and analyze your results)
- Achievable (within the scope of your analysis and budget)
- Relevant (check if you have the necessary resources)
- Timely (stick to the deadlines)
For example, a report documenting a specific social media campaign on Instagram might focus on the level of engagement in their target group. So the objective here would be to track engagement metrics like retweets, shares, comments etc.
Gathering Data
This step involves choosing what to measure depending on your needs and the social platforms you use (Facebook, Instagram, LinkedIn, etc.). Try to incorporate metrics that help your client make informed-choices. Some of the metrics that may be measured are leads (visitors that may potentially become customers), trackable links and conversions (to track the leads generated and following it up with action), reach and impressions (the number of people viewing your social media content) etc. When it comes to reporting results, keep it client-centric and easy-to-understand. Keep it as simple as possible and report the metrics in a consistent manner, each time. Do not report everything just because you can. That is tedious to go through and may confuse your client.
Using the Right Tools
Before you select your tools, it is important to consider a few factors:
- What is the quality of the data?
- Where does the tool gather its social data from?
- Can the tool track owned, earned, and paid social data?
- Does the tool include insights from the networks that you’re looking to report on?
- What features are on its roadmap?
Based on your requirements, you must select an appropriate tool that takes into consideration the rapidly evolving nature of social media platforms. There are many free tools available on the internet but mostly they are limited in what all you can achieve with them. Using a single tool is always preferable to using different tools for each channel. This saves you a lot of time, effort and money.
Building Predictions and Defining the Next Steps
This step involves crunching the numbers to look for specific patterns, trends, and anomalies that help assess the success or failure of your social marketing efforts. This information is used to predict outcomes of future efforts. It is vital to plan out your strategy for the future based on the current data to ensure that you are heading in the correct direction, and not aimlessly squandering away both your time and budget.
Automating your Report for Future Presentations
Once you’ve gathered all your information, it’s finally time to present it! In order to make it an easy read, use images and creative visualizations to depict your data. Charts, graphs, virality maps, conversation clusters, word clouds etc. are some ways of visualizing your data. People retain more information through illustrations. You may also include a short description along with the visual component to aid your analysis. Try to report your data per channel separately. It is usually a tedious task to display all your data clearly on a single slide. The entire process from collecting data to generating illustrations requires a lot of effort and time. Creating Social Media Reports on platforms like INSIA simplify this to a large extent. INSIA provides reports that automate data collection and present your data in an easy-to-understand format that is both comprehensive and visually appealing.
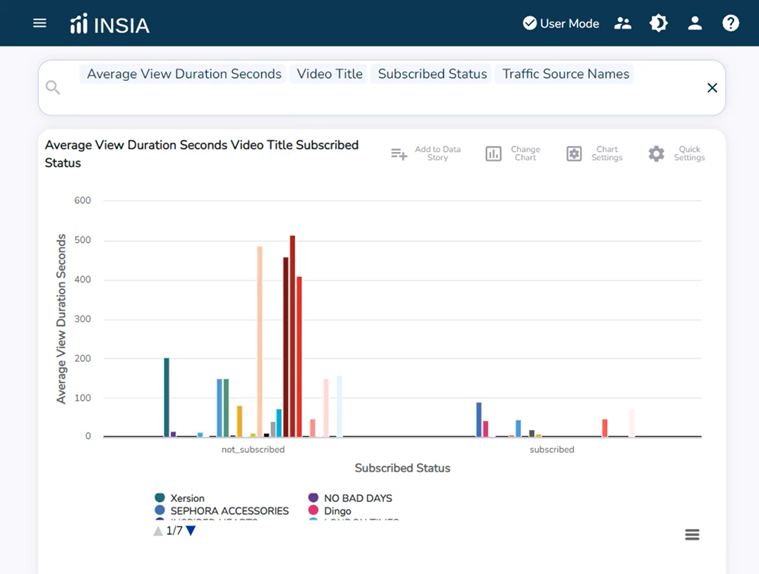
Here you can see the average view duration of a video by subscribers and non-subscribers for different brands.
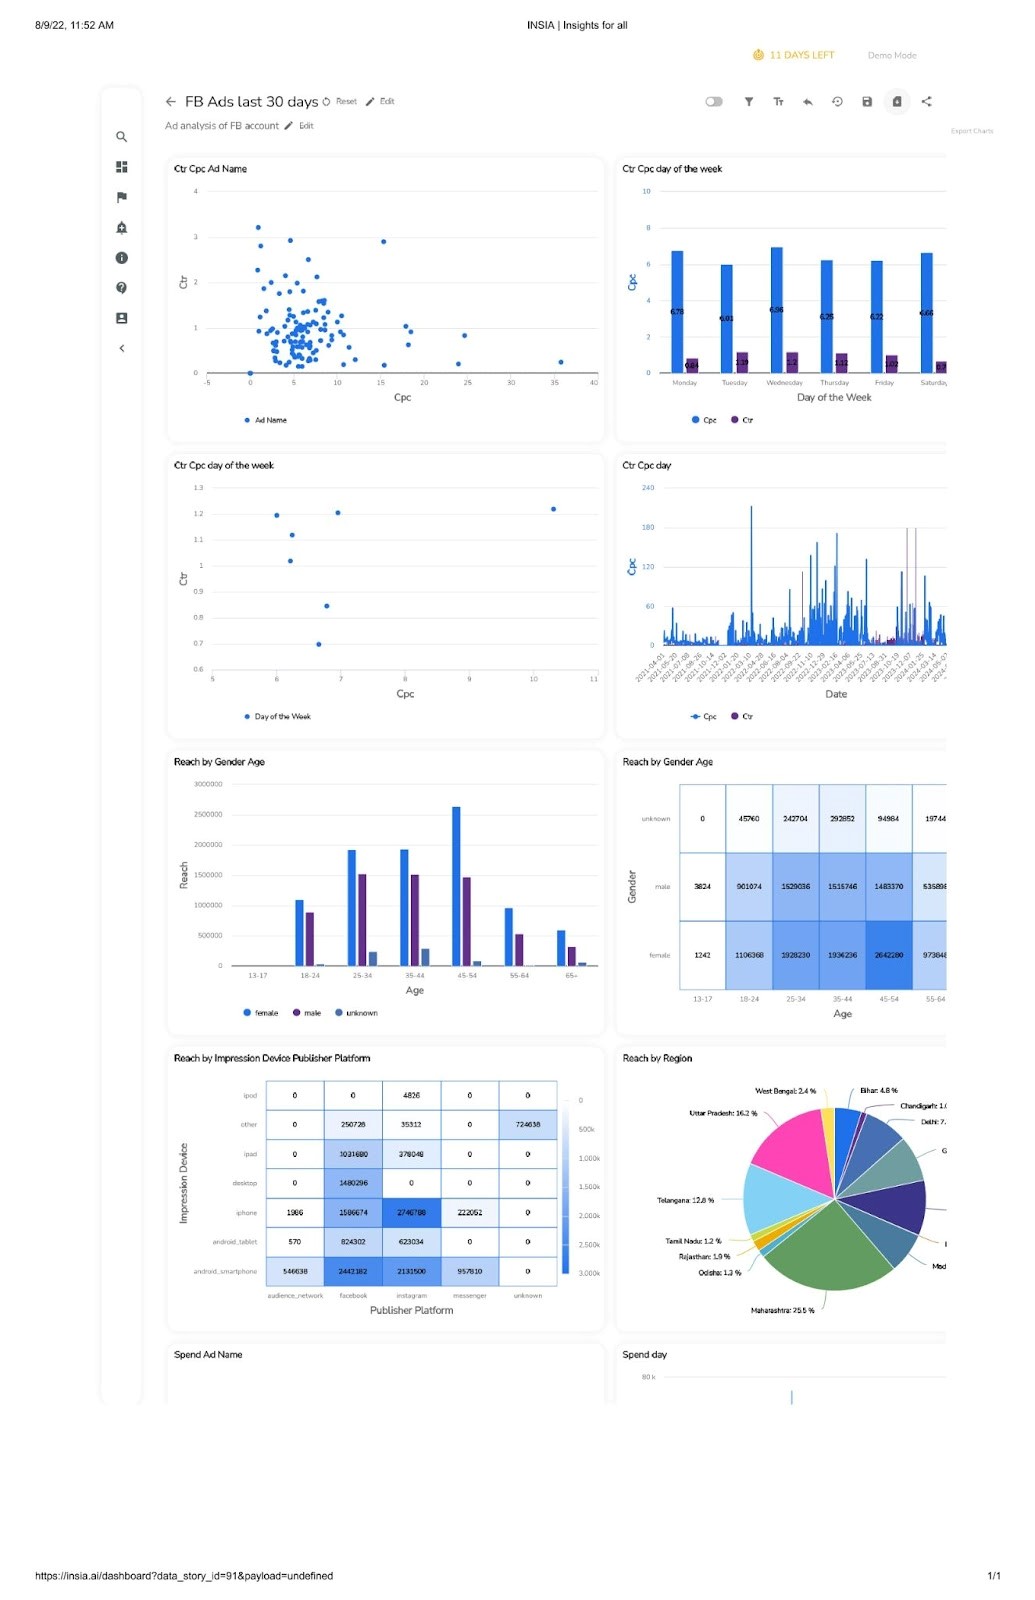
Here is another example of a template displaying data from Facebook Ads. At the top of the report, you have the option of viewing your CTR (click-through-rate) and CPC (cost-per-click) metrics according to the day of the week. This is followed by a chart depicting your reach based on age for both genders. This helps you understand exactly who is viewing your content. At the bottom of the page, you can view your reach through other demographics like impression devices, publisher platforms, and regions. This is just a section of the entire report. Check out all our features by trying our free demo!
Use these Social Media Report Tools for your Ultimate Report
You may be feeling a little overwhelmed with all the work involved in creating your social media report. This is where these amazing, time-saving tools come in handy!
Meta Business Suite
Instagram and Facebook both provide insights on their respective platforms but Meta Business Suite offers you a side-by-side view of both together. This can save you time as you can access Facebook, Instagram, and messaging tools all in one place. It is a free tool that can be used on both desktop and mobile, with easy-to-view notifications. Additionally, you can create or schedule stories, ads and posts.
Head to http://business.facebook.com and click on the ‘Insights’ option on the left menu to access insights for your business. Here are some pros and cons based on reviews and ratings by Meta Business Suite users:
Pros:
- Aggregates all your meta-related applications (Facebook, Instagram etc.)
- You can schedule out posts and videos
- Ad management and demographic based ad targeting
- It’s free!
Cons:
- Ad issues- poor response to troubleshooting tickets
- Lack of customer support
- The interface may take some time to get used to- it is not always intuitive.
- Constant updates may make it hard to keep track of old and new features
- No option to create custom dashboards and to slice/dice the data as needed
- No option to change charts and to find the best visualization for the data
Twitter Analytics
Earlier only open to verified users and advertisers, Twitter has now provided access to its full analytics dashboard to everyone. It can be used on both desktop and mobile. Head to analytics.twitter.com to check it out. To access insights, open your profile and click on the ‘More’ option on the menu. Then click on the ‘Analytics’ to view your data.
Pros:
- It helps you track your growth
- Helps you plan the best time to post your tweets
- Valuable insights that help you understand what your audience wants
- It’s free!
Cons:
- It only gives you insights on Twitter
- No option to perform any ad-hoc analysis
- No option to compare twitter data with other social media data
- No option to create custom dashboards and to slice/dice the data as needed
- No option to change charts and to find the best visualization for the data
- LinkedIn Analytics
Access insights on your LinkedIn page by opening your company page and then clicking on “Analytics” in the menu. You may then choose “Visitors”, “Updates”, “ Followers”, “Competitors” etc. Upon choosing the “Competitor” analytics page, you can compare your page with up to nine others. Analytics are available for all page admin roles. It can be accessed from both desktop and mobile.
Pros:
- Helps you understand how your page’s followership and content compare to your competitors’
- It’s free
Cons:
- Time Consuming
- Doesn’t give you a lot of data
- No CSV export
- No option to create custom dashboards and to slice/dice the data as needed
- No option to change charts and to find the best visualization for the data
INSIA
INSIA is a self-service platform designed for non-technical business users. It integrates and collects your data from multiple sources (like Facebook, Instagram, LinkedIn etc.) and creates visually appealing automated reports. It can be used on both desktop and mobile. Click Here to request a demo.
Automate Your Social Media Insights Reports with INSIA
INSIA collects your data and automatically creates a report for you! You can integrate all your digital channels such as Facebook, Google Analytics, Instagram, Shopify, LinkedIn and more to understand customer touch points and build attribution for better conversions. You may track bounce rate, in-depth audience engagement, and social media KPIs to improve your brand positioning and outreach strategy. INSIA also monitors your ROAS (Return on Ad Spend) by evaluating KPIs such as Reach, CTR, Frequency, CPM, and more across different demographic and geographic segments. It offers over 40 different data visualizations in the forms of charts, graphs, tables, and tiles which help you understand your data. These charts help you visualize & analyze your complex data effortlessly with the availability of multiple options.
INSIA provides an i360 report (insights 360 reports). This is a business report consisting of a complete analysis of your dataset. The i360 report aims to provide the user with all possible insights on the provided data. It presents a detailed breakdown of key metrics and KPIs about your business. You can access all i360 reports under the i360 tab present in the data story webpage.
INSIA allows you to customize your reports and add in custom metrics easily. Automating your Social Media Report has never been easier!