Reactive to Proactive Analysis
Built-in AI and ML Models with Automated ML Ops and Custom Models

AI-Powered Analytics That Pushes Insights Proactively to the Right User at the Right Time
AI Features
Push AI
Reactive to Proactive
Predictive Analysis
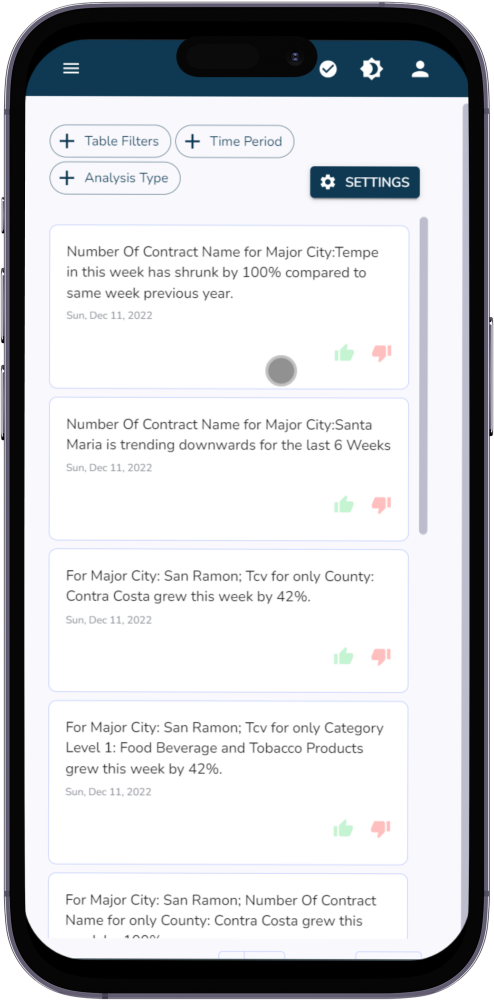
Automated alerts with language & data reports for anomalies
Auto Insights
Automated alerts on business performance deviations
i-360°
Automated alerts with language & data reports for anomalies
Predictive Analytics Toolkit
Build, train, and deploy predictive models without writing a single line of code
Train your own predictive deep learning model without writing a single line of code
Get instant prediction for any metric across different time periods and dimensions
Filter insights to see targeted predictive outcomes for different business scenarios
Prediction that improves over time and gives you the best fit model for your data
Auto Insights
Pushed proactively to your inbox
Get performance updates in plain language
Feedback loop for ongoing learning & sharper insights
Filtering engine for pushing relevant insights only
Auto scheduler for right insights at the right time
i-360° — One Click Auto-Analysis
Complete automated analysis of your data in a single click
Get performance updates in plain language
Feedback loop for ongoing learning and sharper insights
Intelligent filtering engine for pushing relevant insights only
Insight auto scheduler for the right insight at the right time
Varied Analysis for Varied Needs
Right insights at the right time to the right person through proprietary filtering and threshold engine with dynamic control limits
Time comparison
Time series analysis of data to uncover seasonalities and growth
Forecasting
Forecasting to prepare you for future business challenges
Which Where
Identify elements which are winners or losers
Contribution
Identify biggest contributors to a particular scenario
Relationship
Uncover patterns between multiple variables


