Dashboarding Made Easy
No-Code, Agile Dashboarding and Reporting Made Fast and Easy

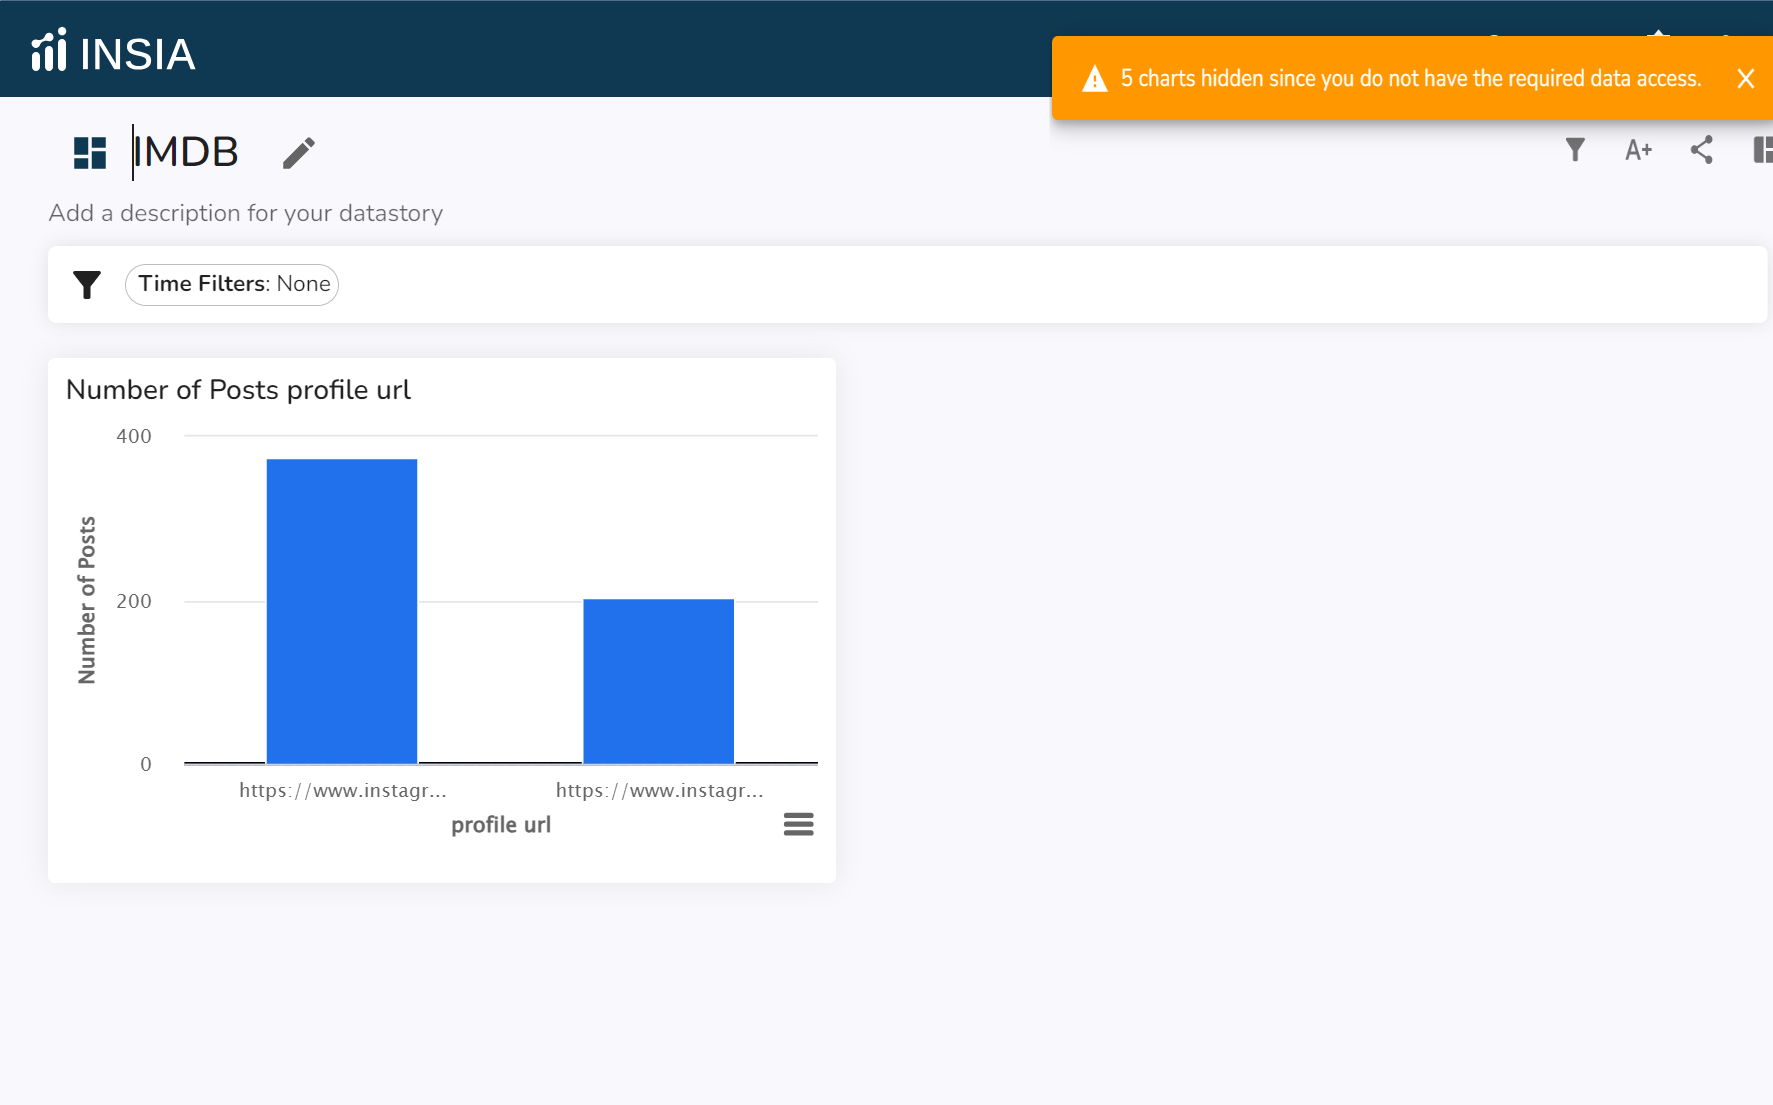
5 Minute Interactive Dashboard
Instant Insights, Endless Stories: Empowering Your Data Journey with Instant Data Stories
With our drag-and-drop functionality, resizing and repositioning charts has never been easier. Seamlessly adjust the size and placement of charts to create the perfect layout for your dashboard. Simply drag to resize and drop to reposition, enabling you to effortlessly customize your data visualization experience.
View DocumentationCollaborate with Teams
Enhancing Data Narratives: Rich Text and Collaborative Comments
Elevate your data stories with rich text and interactive comments. Our platform allows users to seamlessly integrate descriptive text, bold formatting, hyperlinks, and more, providing depth and clarity to insights.
View DocumentationShare With Ease
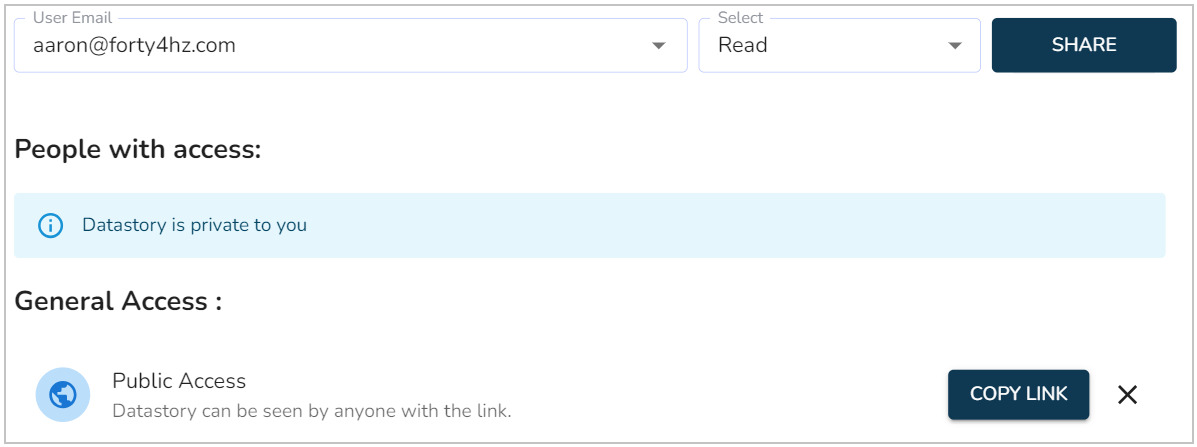
Securely Share to Your Organization or Outside it, or Embed Into Your Product
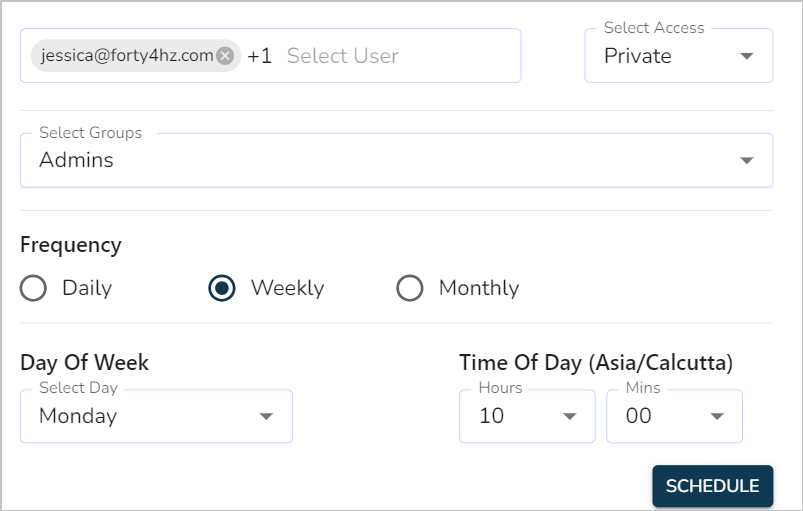
With this functionality, users can schedule automated email deliveries of their data stories to relevant stakeholders. Whether it's daily, weekly, or monthly updates, our platform empowers users to set precise schedules, ensuring that insights are delivered promptly to drive informed decision-making.
View Documentation