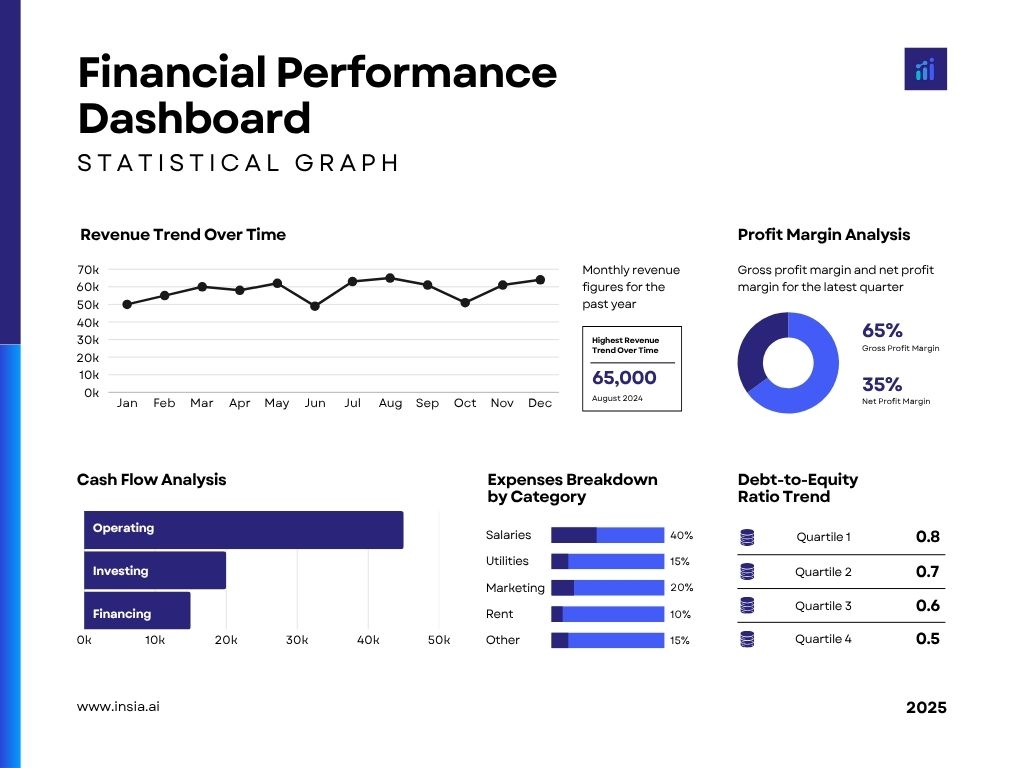
Finance KPIs
Finance KPIs are metrics used to monitor an organization's financial health, performance, and strategic progress.
What are Finance KPIs?
Finance KPIs are key performance indicators that help organizations monitor, analyze, and optimize their financial health. From profitability and cash flow to debt ratios and return on investment, these metrics enable better strategic planning and operational control
Benefits of Tracking Finance KPIs
- Monitor financial health in real time
Finance KPIs provide immediate visibility into the organization’s revenue streams, cost structures, and profitability. By continuously monitoring financial metrics, leadership teams can spot irregularities, track trends, and ensure that the business is operating within healthy financial parameters.
- Improve profitability and operational efficiency
By tracking cost ratios, margins, and cash flow indicators, finance teams can identify areas of waste or inefficiency. This enables smarter budget allocation, streamlined processes, and initiatives that enhance overall profitability and financial performance. - Support budgeting and investment decisions
KPIs such as ROI, working capital, and expense ratios help evaluate the outcomes of strategic decisions. They allow CFOs and finance heads to assess risk, justify expenditures, and prioritize investments based on real-time financial impact and long-term growth potential.
- Enhance risk management and compliance
Monitoring liquidity ratios, debt levels, and regulatory costs ensures that companies maintain financial stability and adhere to compliance requirements. Finance KPIs act as early warning systems for financial distress or audit risks.
-
Accounts Payable Processing Time
Total Time Taken to Process Payables
-
Accounts Receivable Turnaround Time
Total Time to Collect Receivables
-
Asset Turnover Ratio
Net Sales / Average Total Assets
-
Audit Readiness Score
(Audit Issues Resolved / Total Audit Points) * 100
-
Break-Even Analysis
Fixed Costs / Contribution Margin per Unit
-
Budget Adherence Rate
(Budgeted Expenses / Actual Expenses) * 100
-
Budget Variance Analysis
Actual vs Budgeted Expenses or Revenue
-
Capital Expenditure Efficiency
Revenue Generated per Dollar of Capital Expenditure
-
Capital Structure Analysis
Debt vs Equity Ratios
-
Cash Conversion Cycle
DSO + DIO - DPO
-
Cash Flow Adequacy Ratio
(Net Cash Flow from Operations / Debt Obligations)
-
Compliance Reporting Timeliness
(Reports Submitted on Time / Total Reports) * 100
-
Contribution Margin Analysis
(Sales - Variable Costs) / Sales
-
Cost of Goods Sold (COGS) Analysis
Total COGS by Product, Department, or Period
-
Cost Reduction Achievement
(Cost Savings Achieved / Targeted Cost Savings) * 100
-
Current Ratio
Current Assets / Current Liabilities
-
Daily Cash Position
Cash on Hand at Start of Day
-
Days Payables Outstanding (DPO)
(Accounts Payable / COGS) * Number of Days
-
Days Sales Outstanding (DSO)
(Accounts Receivable / Revenue) * Number of Days
-
Debt-to-Equity Ratio
Total Debt / Shareholders' Equity
-
Earnings Before Interest and Taxes (EBIT)
Operating Revenue - Operating Expenses
-
Economic Value Added (EVA)
Net Operating Profit After Taxes (NOPAT) - (Capital x WACC)
-
Expense Processing Time
Total Time Taken to Process Expense Claims
-
Expense to Revenue Ratio
Total Operating Expense / Total Revenue
-
Financial Close Cycle Time
Days to Close Financial Books at Month-End
-
Financial Data Integrity Rate
(Accurate Financial Data Entries / Total Entries) * 100
-
Financial Forecast Accuracy
(Forecasted Revenue - Actual Revenue) / Forecasted Revenue
-
Financial Leverage Ratio
Total Assets / Shareholders' Equity
-
Fixed vs Variable Cost Ratio
Fixed Costs / Variable Costs
-
Forecast Accuracy for Cash Flow
(Forecasted Cash Flow - Actual Cash Flow) / Forecasted Cash Flow
-
Fraud Detection Rate
(Fraud Cases Detected / Total Transactions) * 100
-
Free Cash Flow
Net Cash Flow from Operations - Capital Expenditures
-
Gross Profit Margin
(Revenue - COGS) / Revenue
-
Interest Coverage Ratio
EBIT / Interest Expenses
-
Inventory Turnover Ratio
COGS / Average Inventory
-
Invoice Accuracy Rate
(Accurate Invoices Processed / Total Invoices) * 100
-
Liquidity Ratio Trends
Liquidity Ratios (Current and Quick) Over Time
-
Net Profit Margin
Net Income / Revenue
-
Net Working Capital (NWC) Trends
Current Assets - Current Liabilities Trends Over Time
-
Number of Financial Errors
(Financial Errors / Total Transactions) * 100
-
Operating Cash Flow
Net Cash from Operating Activities
-
Operating Expense Ratio (OER)
Operating Expenses / Total Revenue
-
Operational Expense Trends
Operational Expenses Over Time Trends
-
Overdue Receivables Percentage
(Overdue Receivables / Total Receivables) * 100
-
Overhead Cost Analysis
Total Overhead / Total Revenue
-
Payables Turnover Ratio
Net Credit Purchases / Average Accounts Payable
-
Payroll Error Rate
(Payroll Errors / Total Payroll Transactions) * 100
-
Profitability by Product Line
(Revenue - Direct Costs) / Total Revenue by Product
-
Quick Ratio
(Current Assets - Inventory) / Current Liabilities
-
Receivables Turnover Ratio
Net Credit Sales / Average Accounts Receivable
-
Return on Assets (ROA)
Net Income / Total Assets
-
Return on Capital Employed (ROCE)
Operating Profit / Capital Employed
-
Return on Equity (ROE)
Net Income / Shareholders' Equity
-
Return on Invested Capital (ROIC)
Net Operating Profit After Taxes (NOPAT) / Invested Capital
-
Revenue Growth Rate
(Current Period Revenue - Previous Period Revenue) / Previous Period Revenue
-
Tax Filing Accuracy
(Accurate Tax Submissions / Total Submissions) * 100
-
Total Shareholder Return (TSR)
(Change in Stock Price + Dividends) / Initial Stock Price
-
Unresolved Invoice Count
Invoices Pending for Overdue Period
-
Working Capital Analysis
Current Assets - Current Liabilities
-
Working Capital Turnover
Net Sales / Working Capital